GC Internals and Pacer
GC Internals and Pacer
Overview
Go’s GC is a concurrent, non-moving, mark-sweep collector with a pacer that decides when to start marking so heap growth stays near a target. Go 1.26’s Green Tea GC improves scan locality; the user-facing knobs (GOGC, GOMEMLIMIT) remain the control plane.
Practical tuning: Garbage collection, Allocations & GC.
Companion depth: Internals for Interns — The Garbage Collector (GreenTea / mark phase notes).
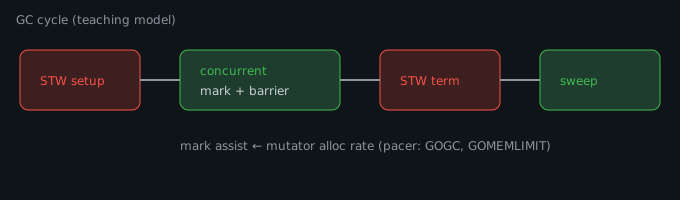
Diagram: GC cycle
  mutator allocates ──► pacer (GOGC / GOMEMLIMIT)
                              │
                              v
                    ┌─────────────────┐
                    │ mark setup STW  │  (short)
                    └────────┬────────┘
                             v
                    ┌─────────────────┐
                    │ concurrent mark │◄── mark assist from allocators
                    │  + write barrier│
                    └────────┬────────┘
                             v
                    ┌─────────────────┐
                    │ mark term STW   │  (short)
                    └────────┬────────┘
                             v
                    ┌─────────────────┐
                    │ concurrent sweep│  reclaim spans
                    └─────────────────┘
Heap Building Blocks
arena / pages
    -> spans (size classes for small objects)
        -> objects
large objects: dedicated spans
Allocators (per-P caches) reduce cross-thread contention. When caches miss, they pull from central free lists / the heap.
Tri-color intuition
  white (unmarked) ──reach──► grey (to-scan) ──scan kids──► black
       │
       └── not reached ──► sweep reclaim
Write barriers keep the invariant safe while mutators run during concurrent mark.
Mark and Sweep Phases
1. Mark setup      STW (short)  — enable write barrier, root prep
2. Concurrent mark             — workers + mutator assists
3. Mark termination STW (short)
4. Concurrent sweep            — reclaim unmarked objects by span
Write barrier
While marking, pointer writes are instrumented so the GC does not lose objects. Barriers add a small tax on pointer-heavy code — one reason reducing pointer count (or packing) helps.
Mark assist
If the mutator allocates faster than markers can scan, the allocating G helps mark. This couples allocation rate to GC CPU and shows up as latency on the allocating path — not only in a GC thread.
Pacer Goals
The pacer aims roughly:
live heap after GC * (1 + GOGC/100) ≈ heap size that triggers next GC- GOGC=100 (default): next GC when heap roughly doubles live size.
- Lower GOGC → more frequent GC, less peak memory.
- Higher GOGC → less GC CPU, more memory.
GOMEMLIMIT
Soft limit on Go-managed memory. When approaching the limit, GC becomes more aggressive (and may return memory to the OS more eagerly depending on version/settings). Use with container memory limits to reduce OOM-kills:
GOMEMLIMIT=512MiB GOGC=100 ./servicePrefer limit + reasonable GOGC over GOGC=off fantasies.
Green Tea GC (1.26+)
Span-aware scanning improves cache locality for pointer-rich heaps. Opt-out for experiments:
GOEXPERIMENT=nogreenteagc ./serviceValidate with your workload’s p95 and CPU profiles — do not assume every service wins equally.
Reading GC Telemetry
var m runtime.MemStats
runtime.ReadMemStats(&m)
// m.NumGC, GCCPUFraction, HeapAlloc, HeapInuse, NextGC, PauseTotalNs
Or metrics:
go_gc_duration_seconds
go_memstats_heap_alloc_bytes
go_memstats_next_gc_bytes
Latency pattern
Periodic p95 spikes aligned with NumGC increases often mean assist or STW, not “Go is slow.” Fixes: fewer allocs, smaller pointer graphs, raise memory budget, or smooth allocation rate.
Design Rules
- Allocate less before tuning GOGC.
- Reuse buffers (
[]bytepools) on hot paths. - Avoid pointer-heavy tiny objects in huge graphs when possible (flatten).
- Set GOMEMLIMIT in containers.
- Profile —
pprofheap +traceGC events.
Experiment
go mod init example
go run .
package main
import (
"fmt"
"runtime"
"time"
)
func stats(label string) {
var m runtime.MemStats
runtime.ReadMemStats(&m)
fmt.Printf("%s alloc=%dKiB nextGC=%dKiB numGC=%d gccpu=%.3f\n",
label,
m.Alloc/1024,
m.NextGC/1024,
m.NumGC,
m.GCCPUFraction,
)
}
func main() {
stats("start")
keep := make([][]byte, 0, 1000)
for i := 0; i < 1000; i++ {
keep = append(keep, make([]byte, 32*1024))
}
stats("after alloc")
keep = nil
runtime.GC()
time.Sleep(50 * time.Millisecond)
stats("after GC")
}What to notice: NextGC rises with live heap; forced GC drops alloc; GCCPUFraction is a long-run average (not instant).
Try next: Run the same under GOGC=50 vs GOGC=200 and compare NumGC after identical work.