sys.monitoring: Low-Overhead Debuggers and Coverage (PEP 669)
sys.monitoring: Low-Overhead Debuggers and Coverage (PEP 669)
Thesis
For twenty years every Python debugger and coverage tool was built on sys.settrace. You install one function, and the interpreter calls it on every function call and every line in every frame it traces. It can never stop calling that function at a single place, so a breakpoint inside a hot loop slows the entire program down. Python 3.12 added a second mechanism, sys.monitoring (PEP 669). A tool picks the events it wants and registers a callback for each. The interpreter instruments only those places in the bytecode. Most important, a callback can return sys.monitoring.DISABLE to say “never call me at this location again.” That one return value is where nearly all the speed comes from. A line-coverage tool that disables each line after the first hit runs a hot loop at roughly native speed. The same tool without DISABLE is about as slow as settrace.
It is not an experimental corner. On 3.14 and 3.15, breakpoint() and python -m pdb run on it, and so does coverage.py’s default measurement core. IDE debuggers are moving to it as well. This chapter builds the same three tools in miniature (a call counter, a line-and-branch coverage tool, and a breakpoint) and measures what each design decision costs.
Version note: every listing was run on CPython 3.15.0 (released 2026-10-09) and, where the output differs, CPython 3.14.8, both from uv (python-build-standalone, Linux x86-64). The box was shared with other jobs, so the timings carry about ±20% noise. Read the ratios, not the milliseconds. Coverage.py is 7.16.2, run through uvx without installing it into any project.
Mental model
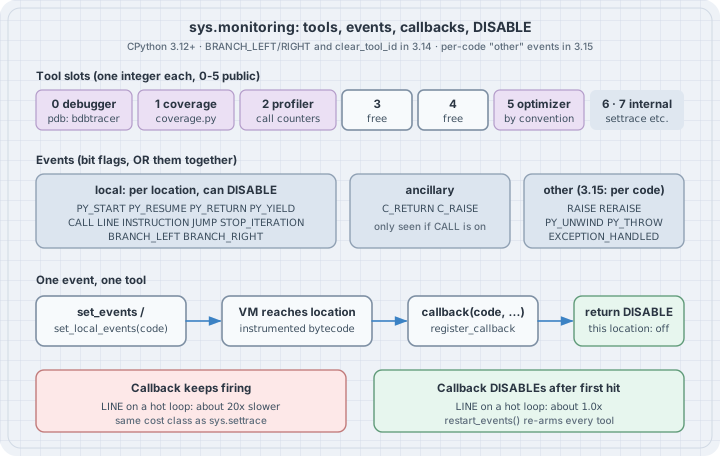
sys.monitoringis a namespace, not a module. Writeimport sysand usesys.monitoring.import sys.monitoringfails.- A tool is an integer slot, 0 to 5. Claim one with
use_tool_id(id, name)and release it withfree_tool_id(id). Conventions:DEBUGGER_ID = 0,COVERAGE_ID = 1,PROFILER_ID = 2,OPTIMIZER_ID = 5. CPython keeps two more internal slots, 6 and 7, forsys.setprofileandsys.settrace(PY_MONITORING_SYS_PROFILE_ID/PY_MONITORING_SYS_TRACE_IDinInclude/internal/pycore_instruments.h). That is why the old API and the new one can run side by side. - Events are bit flags. OR them together and pass the result to
set_events(tool, mask)for the whole interpreter, or toset_local_events(tool, code, mask)for one code object. Nothing is on by default. - Callbacks get the code object, not a frame.
LINEcallbacks receive(code, line_number). Branch and jump callbacks receive(code, instruction_offset, destination_offset). If you need locals,sys._getframe(1)inside the callback is the frame being monitored. DISABLEis per location, per tool. Returning it from a local event switches off that event at that one instruction for your tool only.restart_events()turns every disabled location back on, for all tools.- What changed recently. 3.14 added
BRANCH_LEFT/BRANCH_RIGHT(replacing the now-deprecatedBRANCH) andclear_tool_id(). Also in 3.14,free_tool_id()began clearing a tool’s events and callbacks; before that it left them registered. 3.15 lets the “other” events (RAISE,RERAISE,PY_UNWIND,PY_THROW,EXCEPTION_HANDLED) be turned on per code object and acceptDISABLE(gh-146182). Case 7 shows exactly what that does.
Worked examples
Case 1: The smallest tool: count function starts
# hello_monitor.py
import sys
from collections import Counter

mon = sys.monitoring
TOOL = mon.PROFILER_ID          # 2: the slot reserved by convention for profilers
starts = Counter()


def on_start(code, instruction_offset):
    starts[code.co_qualname] += 1


def fib(n):
    return n if n < 2 else fib(n - 1) + fib(n - 2)


def main():
    return [fib(n) for n in range(10)]


mon.use_tool_id(TOOL, "call-counter")
mon.register_callback(TOOL, mon.events.PY_START, on_start)
mon.set_events(TOOL, mon.events.PY_START)
try:
    result = main()
finally:
    mon.set_events(TOOL, mon.events.NO_EVENTS)
    mon.free_tool_id(TOOL)

print(result)
for name, n in starts.most_common():
    print(f"{n:5d}  {name}")
print("tool 2 after free:", mon.get_tool(TOOL))
python3.15 hello_monitor.pyOutput:
[0, 1, 1, 2, 3, 5, 8, 13, 21, 34]
  276  fib
    1  main
tool 2 after free: None
That is the whole lifecycle: claim a slot, register a callback, turn events on, run the code, turn events off, and free the slot. The try/finally matters, because a tool that dies without freeing its slot blocks the next tool that wants it (see The trap). There is no <listcomp> entry: since 3.12 a list comprehension runs inline in its function (PEP 709), so it never starts a code object of its own.
Case 2: Where the speed actually comes from
One CPU-bound loop, timed four ways (best of five runs): no tool; a classic sys.settrace line tracer; a sys.monitoring LINE callback that keeps firing; and the same callback returning DISABLE after it records a line.
# bench_tracers.py
import sys
import time

mon = sys.monitoring
TOOL = mon.COVERAGE_ID          # 1


def workload():
    total = 0
    for i in range(1_000_000):
        if i % 3:
            total += i
        else:
            total -= 1
    return total


def run(label, setup, teardown, baseline=None):
    best = float("inf")
    for _ in range(5):
        setup()
        t0 = time.perf_counter()
        workload()
        best = min(best, time.perf_counter() - t0)
        teardown()
    extra = f"  {best / baseline:5.1f}x" if baseline else ""
    print(f"{label:<34} {best * 1000:7.1f} ms{extra}")
    return best


seen = set()


def settrace_line(frame, event, arg):            # what coverage tools did before 3.12
    if event == "line":
        seen.add((frame.f_code, frame.f_lineno))
    return settrace_line


def mon_line(code, line):                       # sys.monitoring, keep firing
    seen.add((code, line))


def mon_line_once(code, line):                  # sys.monitoring, fire once per line
    seen.add((code, line))
    return mon.DISABLE


def use(cb):
    def setup():
        mon.use_tool_id(TOOL, "bench")
        mon.register_callback(TOOL, mon.events.LINE, cb)
        mon.set_events(TOOL, mon.events.LINE)
    return setup


def off():
    mon.free_tool_id(TOOL)          # 3.14+: also clears events and callbacks
    mon.restart_events()            # re-arm DISABLEd locations for the next run


print(sys.version.split()[0])
base = run("no tool", lambda: None, lambda: None)
run("sys.settrace line tracer", lambda: sys.settrace(settrace_line), lambda: sys.settrace(None), base)
run("sys.monitoring LINE", use(mon_line), off, base)
run("sys.monitoring LINE + DISABLE", use(mon_line_once), off, base)
python3.14 bench_tracers.py
python3.15 bench_tracers.pyOutput:
3.14.8
no tool                               36.5 ms
sys.settrace line tracer             978.7 ms   26.8x
sys.monitoring LINE                  810.1 ms   22.2x
sys.monitoring LINE + DISABLE         33.8 ms    0.9x
3.15.0
no tool                               36.8 ms
sys.settrace line tracer             907.1 ms   24.7x
sys.monitoring LINE                  824.0 ms   22.4x
sys.monitoring LINE + DISABLE         38.0 ms    1.0x
Read the third row before the fourth. Swapping settrace for sys.monitoring on its own saves only 10–20% (17% on 3.14.8 and 9% on 3.15.0 in this run), because a Python callback on every line costs roughly the same either way. The fourth row is the design change. Once each line has reported itself and returned DISABLE, the interpreter removes the instrumentation from that location and the loop runs at native speed. The 0.9× and 1.0× are noise around 1×. In earlier runs on this shared box under heavy load, the same row read up to 1.7× while the other rows swung between 18× and 28×, so compare rows within one run, not across runs. A sys.monitoring tool is fast only if it disables everything it has finished with.
Case 3: A line + branch coverage tool in about 65 lines
The program under test and a driver that calls it 2,000 times:
# shipping.py
def shipping_cost(weight_kg, express=False, country="IN"):
    if weight_kg <= 0:
        raise ValueError("weight must be positive")
    cost = 40 + 12 * weight_kg
    if express:
        cost *= 2
    if country != "IN":
        cost += 300
    return round(cost, 2)
# minicov.py
"""Line + branch coverage in about 65 lines, on sys.monitoring (Python 3.14+)."""
import sys
from collections import defaultdict
mon = sys.monitoring
E = mon.events
TOOL = mon.COVERAGE_ID
lines_hit = defaultdict(set) # filename -> {line}
branches_hit = defaultdict(set) # (filename, line) -> {destination line}
calls = defaultdict(int) # filename -> how often our callbacks ran there
def _line_of(code, offset):
for start, end, line in code.co_lines():
if start <= offset < end:
return line
return None
def _on_line(code, line):
calls[code.co_filename] += 1
lines_hit[code.co_filename].add(line)
return mon.DISABLE # seen once is enough: never call us here again
def _on_branch(code, offset, dest):
calls[code.co_filename] += 1
src, dst = _line_of(code, offset), _line_of(code, dest)
branches_hit[(code.co_filename, src)].add(dst)
return mon.DISABLE # disables this direction only; the other stays armed
def start():
mon.use_tool_id(TOOL, "minicov")
mon.register_callback(TOOL, E.LINE, _on_line)
mon.register_callback(TOOL, E.BRANCH_LEFT, _on_branch)
mon.register_callback(TOOL, E.BRANCH_RIGHT, _on_branch)
mon.set_events(TOOL, E.LINE | E.BRANCH_LEFT | E.BRANCH_RIGHT)
def stop():
mon.free_tool_id(TOOL)
def executable_lines(code):
"""Every line a code object (and its nested code objects) can execute."""
out = {line for _, _, line in code.co_lines() if line} # None/0: no source line
for const in code.co_consts:
if hasattr(const, "co_lines"):
out |= executable_lines(const)
return out
def report(module):
fn = module.__file__
src = compile(open(fn).read(), fn, "exec")
want, got = executable_lines(src), lines_hit[fn]
print(f"{fn.rsplit('/', 1)[-1]}: {len(got & want)}/{len(want)} lines, missed {sorted(want - got)}")
for (f, line), dests in sorted(branches_hit.items()):
if f == fn:
print(f" branch at line {line}: went to {sorted(dests)} ({len(dests)} of 2 directions)")
print(f" callbacks in {fn.rsplit('/', 1)[-1]}: {calls[fn]}; in all files: {sum(calls.values())}")# run_shipping.py
import minicov
minicov.start()
import shipping # imported under coverage, like a real test run
for _ in range(1000): # a hot loop: callbacks must not scale with it
shipping.shipping_cost(1)
shipping.shipping_cost(2.5, express=True)
minicov.stop()
minicov.report(shipping)python3.15 run_shipping.pyOutput:
shipping.py: 7/9 lines, missed [4, 9]
  branch at line 3: went to [5] (1 of 2 directions)
  branch at line 6: went to [7, 8] (2 of 2 directions)
  branch at line 8: went to [10] (1 of 2 directions)
  callbacks in shipping.py: 11; in all files: 456
The loop executed shipping_cost 2,000 times. Our callbacks ran 11 times in shipping.py: 7 lines plus 4 branch directions, each once. Every later execution of those instructions paid nothing. The 400-odd callbacks elsewhere are the import system and the standard library seen once each and disabled, because the events were turned on globally. A real tool would filter by filename and return DISABLE there too, as this one does.
Branches are reported by destination line, not as “left” or “right”. The documentation promises only that a given branch’s direction stays consistent for the life of the program, not which one is which. line 3 → [5] means weight_kg <= 0 was never true, and line 8 → [10] means no order shipped abroad.
Case 4: Check it against the real tool
coverage.py chooses sys.monitoring (“SysMonitor” core) by default on 3.14+. Run it on the same calls without minicov:
# test_shipping.py
import shipping

for _ in range(1000):
    shipping.shipping_cost(1)
    shipping.shipping_cost(2.5, express=True)
uvx --python 3.15 --from coverage==7.16.2 coverage run --debug=sys --branch test_shipping.py 2>&1 | grep -E '^ +(coverage_version|core):'
uvx --python 3.15 --from coverage==7.16.2 coverage report -m --include=shipping.pyOutput:
               coverage_version: 7.16.2
                           core: SysMonitor
Name          Stmts   Miss Branch BrPart  Cover   Missing
---------------------------------------------------------
shipping.py       9      2      6      2    73%   4, 9
---------------------------------------------------------
TOTAL             9      2      6      2    73%
The two tools agree: lines 4 and 9 are missed, 9 statements, and two of the three ifs went only one way (6 branch destinations, 2 partial). coverage.py’s [run] core setting documents the choice: ctrace was the default until 3.13, and sysmon is the default on 3.14+, with some features (plugins, dynamic contexts, some concurrency options) not yet supported on sysmon.
Case 5: A breakpoint that costs nothing until it hits
A debugger needs only one line, so it should watch only one code object. set_local_events turns LINE on for orders.price alone. Every line in that function that is not the breakpoint disables itself the first time it is seen.
# orders.py
def price(item):
    total = item["qty"] * item["unit"]
    if item["qty"] > 900:           # the rare case we want to inspect
        total *= 0.9
    return total


def run(n=200_000):
    items = [{"qty": i % 1000, "unit": 3} for i in range(n)]
    return sum(price(it) for it in items)
# tinybp.py
import sys
import time
import orders
mon = sys.monitoring
TOOL = mon.DEBUGGER_ID
stats = {"callbacks": 0, "hits": 0}
def break_at(func, lineno, action):
"""Call action(frame) whenever func reaches lineno. Nothing else is watched."""
def on_line(code, line):
stats["callbacks"] += 1
if line != lineno:
return mon.DISABLE # this line is never interesting: stop calling us here
stats["hits"] += 1
action(sys._getframe(1)) # the frame that is executing `func`
mon.use_tool_id(TOOL, "tinybp")
mon.register_callback(TOOL, mon.events.LINE, on_line)
mon.set_local_events(TOOL, func.__code__, mon.events.LINE) # one code object only
def settrace_break_at(func, lineno, action):
"""The pre-3.12 way: a trace function that sees every call and every line."""
def tracer(frame, event, arg):
stats["callbacks"] += 1
if frame.f_code is not func.__code__:
return None # do not trace other functions' lines
if event == "line" and frame.f_lineno == lineno:
stats["hits"] += 1
action(frame)
return tracer
sys.settrace(tracer)
first = []
def show(frame):
if not first:
first.append(dict(frame.f_locals))
def timed(label):
t0 = time.perf_counter()
orders.run()
print(f"{label:<26} {(time.perf_counter() - t0) * 1000:7.1f} ms hits={stats['hits']} callbacks={stats['callbacks']}")
BP = orders.price.__code__.co_firstlineno + 3 # the `total *= 0.9` line
timed("no debugger")
settrace_break_at(orders.price, BP, show)
timed("settrace breakpoint")
sys.settrace(None)
stats.update(callbacks=0, hits=0)
break_at(orders.price, BP, show)
timed("sys.monitoring breakpoint")
mon.free_tool_id(TOOL)
print("first hit locals:", first[0])python3.15 tinybp.py
python3.15 tinybp.pyOutput (two runs):
no debugger                   61.8 ms  hits=0  callbacks=0
settrace breakpoint          245.2 ms  hits=19800  callbacks=1219803
sys.monitoring breakpoint     67.5 ms  hits=19800  callbacks=19803
first hit locals: {'item': {'qty': 901, 'unit': 3}, 'total': 2703}
no debugger                   63.5 ms  hits=0  callbacks=0
settrace breakpoint          250.7 ms  hits=19800  callbacks=1219803
sys.monitoring breakpoint     67.9 ms  hits=19800  callbacks=19803
first hit locals: {'item': {'qty': 901, 'unit': 3}, 'total': 2703}
Both debuggers stopped 19,800 times and saw the same locals. The settrace version was called 1,219,803 times: once for every new frame in the process, plus every line of price, on 200,000 calls. It made the run about 4× slower (245–251 ms against 62–64 ms). The sys.monitoring version was called 19,803 times (3 lines disabled at first sight, plus the 19,800 real hits), and its run time is within about 10% of no debugger at all (67–68 ms), which is about the run-to-run noise here. This is the effect the sys.monitoring documentation describes: “a program can be run under a debugger with no overhead if the debugger disables all monitoring except for a few breakpoints.”
Case 6: breakpoint() already uses it
On 3.14+, breakpoint(), pdb.set_trace() and the python -m pdb CLI always use the sys.monitoring backend (pdb docs). Explicitly constructed pdb.Pdb() objects default to settrace unless you call pdb.set_default_backend("monitoring"). Ask pdb which tool holds slot 0:
# pdb_backend.py
import sys


def handler(x):
    y = x * 2
    breakpoint()
    return y


print(handler(21))
print("after pdb, tool 0 is:", sys.monitoring.get_tool(sys.monitoring.DEBUGGER_ID))
printf 'p sys.monitoring.get_tool(sys.monitoring.DEBUGGER_ID)\np y\nc\n' | python3.15 pdb_backend.pyOutput:
> /tmp/sysmon/pdb_backend.py(7)handler()
-> breakpoint()
(Pdb) 'bdbtracer'
(Pdb) 42
(Pdb) 42
after pdb, tool 0 is: None
pdb’s bdb layer registers as bdbtracer in DEBUGGER_ID and frees the slot when you continue. The same script prints identical output on 3.14.8.
Case 7: 3.15 lets exception events be per code object
RAISE is one of the “other” events. Through 3.14 it could only be turned on globally, and returning DISABLE from it was an error. 3.15 changes both. Run the same tool four ways:
# raise_local.py
import sys

mon = sys.monitoring
TOOL = 3
seen = []


def on_raise(code, instruction_offset, exc):
    seen.append(type(exc).__name__)
    return mon.DISABLE


def lookup():
    for key in ("a", "b", "c"):
        try:
            {}[key]
        except KeyError:
            pass


mon.use_tool_id(TOOL, "raise-watch")
mon.register_callback(TOOL, mon.events.RAISE, on_raise)
mode = sys.argv[1]
try:
    if mode == "local":
        mon.set_local_events(TOOL, lookup.__code__, mon.events.RAISE)
    else:
        mon.set_events(TOOL, mon.events.RAISE)
    lookup()
    lookup()
except ValueError as e:
    print(f"ValueError: {e}")
print(f"{sys.version.split()[0]} {mode:<6} RAISE callbacks: {len(seen)}")
for v in 3.14 3.15; do for m in global local; do python$v raise_local.py $m; done; doneOutput:
ValueError: Cannot disable RAISE events. Callback removed.
3.14.8 global RAISE callbacks: 1
ValueError: invalid local event set 0x800
3.14.8 local  RAISE callbacks: 0
3.15.0 global RAISE callbacks: 6
3.15.0 local  RAISE callbacks: 1
On 3.14 the global DISABLE raises ValueError and unregisters the callback, so a careless exception tracker silently stops tracking after one event. Turning RAISE on locally is rejected outright (0x800 is the RAISE bit). On 3.15.0 the local form works as the What’s New entry describes: one callback, then RAISE is off for lookup’s code object for this tool. With RAISE on globally, 3.15.0 accepts DISABLE without an error, but the callback kept firing for all six exceptions on this build. Watching exceptions in a hot function with almost no cost means set_local_events on that function’s code object.
The trap
restart_events() re-arms every tool, not just yours. It is the obvious call for a debugger that wants to re-check its disabled lines after the user adds a breakpoint. Run the coverage tool from Case 3 while some other code calls it once per loop iteration:
# run_shipping_restart.py
import sys

import minicov

minicov.start()
import shipping

for _ in range(1000):
    shipping.shipping_cost(1)
    shipping.shipping_cost(2.5, express=True)
    sys.monitoring.restart_events()     # some *other* tool "re-arming its breakpoints"
minicov.stop()
minicov.report(shipping)
python3.15 run_shipping_restart.pyOutput:
shipping.py: 7/9 lines, missed [4, 9]
  branch at line 3: went to [5] (1 of 2 directions)
  branch at line 6: went to [7, 8] (2 of 2 directions)
  branch at line 8: went to [10] (1 of 2 directions)
  callbacks in shipping.py: 10001; in all files: 15431
The report is still correct, but the coverage tool’s callbacks went from 11 to 10,001 in shipping.py, and from 456 to over 15,000 overall. Each restart_events() undid every DISABLE the coverage tool had earned. In a large test suite running under a debugger or a profiler that restarts events often, that is how a coverage run can suddenly get several times slower with no change to the coverage tool. The documentation says it plainly: restart_events() enables all disabled events “for all tools”. If you write a tool, re-arm your own locations with set_local_events on the code objects you care about, and keep restart_events() for when you really mean everyone.
Squatting on someone else’s slot. The slot numbers are conventions, but the debugger relies on its slot:
# squat.py
import sys

mon = sys.monitoring
mon.use_tool_id(mon.DEBUGGER_ID, "my-call-counter")   # wrong slot for a counter

def handler(x):
    y = x * 2
    breakpoint()
    return y

print(handler(21))
printf 'c\n' | python3.15 squat.py 2>&1 | tail -3Output:
  File "/home/box/.local/share/uv/python/cpython-3.15.0-linux-x86_64-gnu/lib/python3.15/bdb.py", line 57, in start_trace
    raise ValueError('Another debugger is using the monitoring tool')
ValueError: Another debugger is using the monitoring tool
A call counter that grabbed slot 0 has made breakpoint() unusable for the whole process. Use the slot that matches your tool’s role (PROFILER_ID for counters and profilers, 3 or 4 for anything else), check get_tool(id) before use_tool_id, and always free_tool_id in a finally.
The boring rule
- Prefer
sys.monitoringtosys.settracefor any new debugger, coverage tool, or profiler on Python 3.12+. On 3.14+, useBRANCH_LEFT/BRANCH_RIGHT, never the deprecatedBRANCH. - Return
DISABLEfrom every local-event callback as soon as that location has told you what you need. A tool that never disables is a slowsettrace. - Scope with
set_local_events(tool, code, mask)when you know which functions matter; use globalset_eventsonly for genuinely whole-program questions. - Claim the slot that matches your role, check
get_tool()first, andfree_tool_id()infinally. On 3.14+ that also clears your events and callbacks. - Never call
restart_events()from a library: it re-arms every tool in the process. - On 3.15, watch exceptions in hot code with
set_local_events(..., RAISE)plusDISABLE. On 3.14 and earlier, never returnDISABLEfrom aRAISE-family callback: it raisesValueErrorand removes your callback.
Try this
- Add
PY_RETURNtohello_monitor.pyand print each function’s maximum recursion depth. Which events do you need to keep the depth correct whenfibraises? - Extend
minicov.pyto print a missed branch as3->4the way coverage.py does. You know the taken destination; usedis.get_instructions(code)to find the other target of the conditional jump. - Change
tinybp.pyso thatbreak_atcan be called again for a different line after the first run. Re-arm onlyorders.price.__code__, not every tool. - If
sys._jit.is_available()is true on your 3.15 build, runbench_tracers.pywithPYTHON_JIT=1and withPYTHON_JIT=0. DoesDISABLEstill return the loop to native speed with the JIT on? - Write a
RAISE+EXCEPTION_HANDLEDtool that reports exceptions raised and caught inside the same function, which is a common performance smell. Use local events on 3.15 and make it fall back to global events withoutDISABLEon 3.14.
Sources
- PEP 669 — Low Impact Monitoring for CPython
sys.monitoring— Execution event monitoring (3.15 documentation; tool IDs, event kinds,DISABLE,restart_events, callback signatures)- What’s New in Python 3.14: sys.monitoring, pdb, bdb (
BRANCH_LEFT/BRANCH_RIGHT,clear_tool_id,free_tool_idchange, monitoring backends) - What’s New in Python 3.15: sys.monitoring (per-code-object “other” events, gh-146182)
pdb.set_default_backend- PEP 709 — Inlined comprehensions
- coverage.py configuration:
[run] core - CPython 3.15.0 source:
Lib/bdb.py(_MonitoringTracer,DEBUGGER_ID,bdbtracer),Include/internal/pycore_instruments.h(slots 6 and 7)